SStudio.
Case Study · Glasgow 2024

A tool that turns
abstract energy data
into things people
can actually picture.

Energy Citizen is an interactive tool that helps Glasgow residents become active participants in renewable energy — not just consumers of it. It makes invisible options visible (eco-villages, community co-ops, portable kits), translates abstract energy data into outcomes people can picture, and collects engagement data that feeds back to community organisations and policy makers.

Energy Citizen live product
Live · Interactive
Role
UX Research
Service Design
Dashboard design
Timeline
12 weeks
2024
Partners
Community Energy Glasgow
Friends of the Earth
01 · The Insight

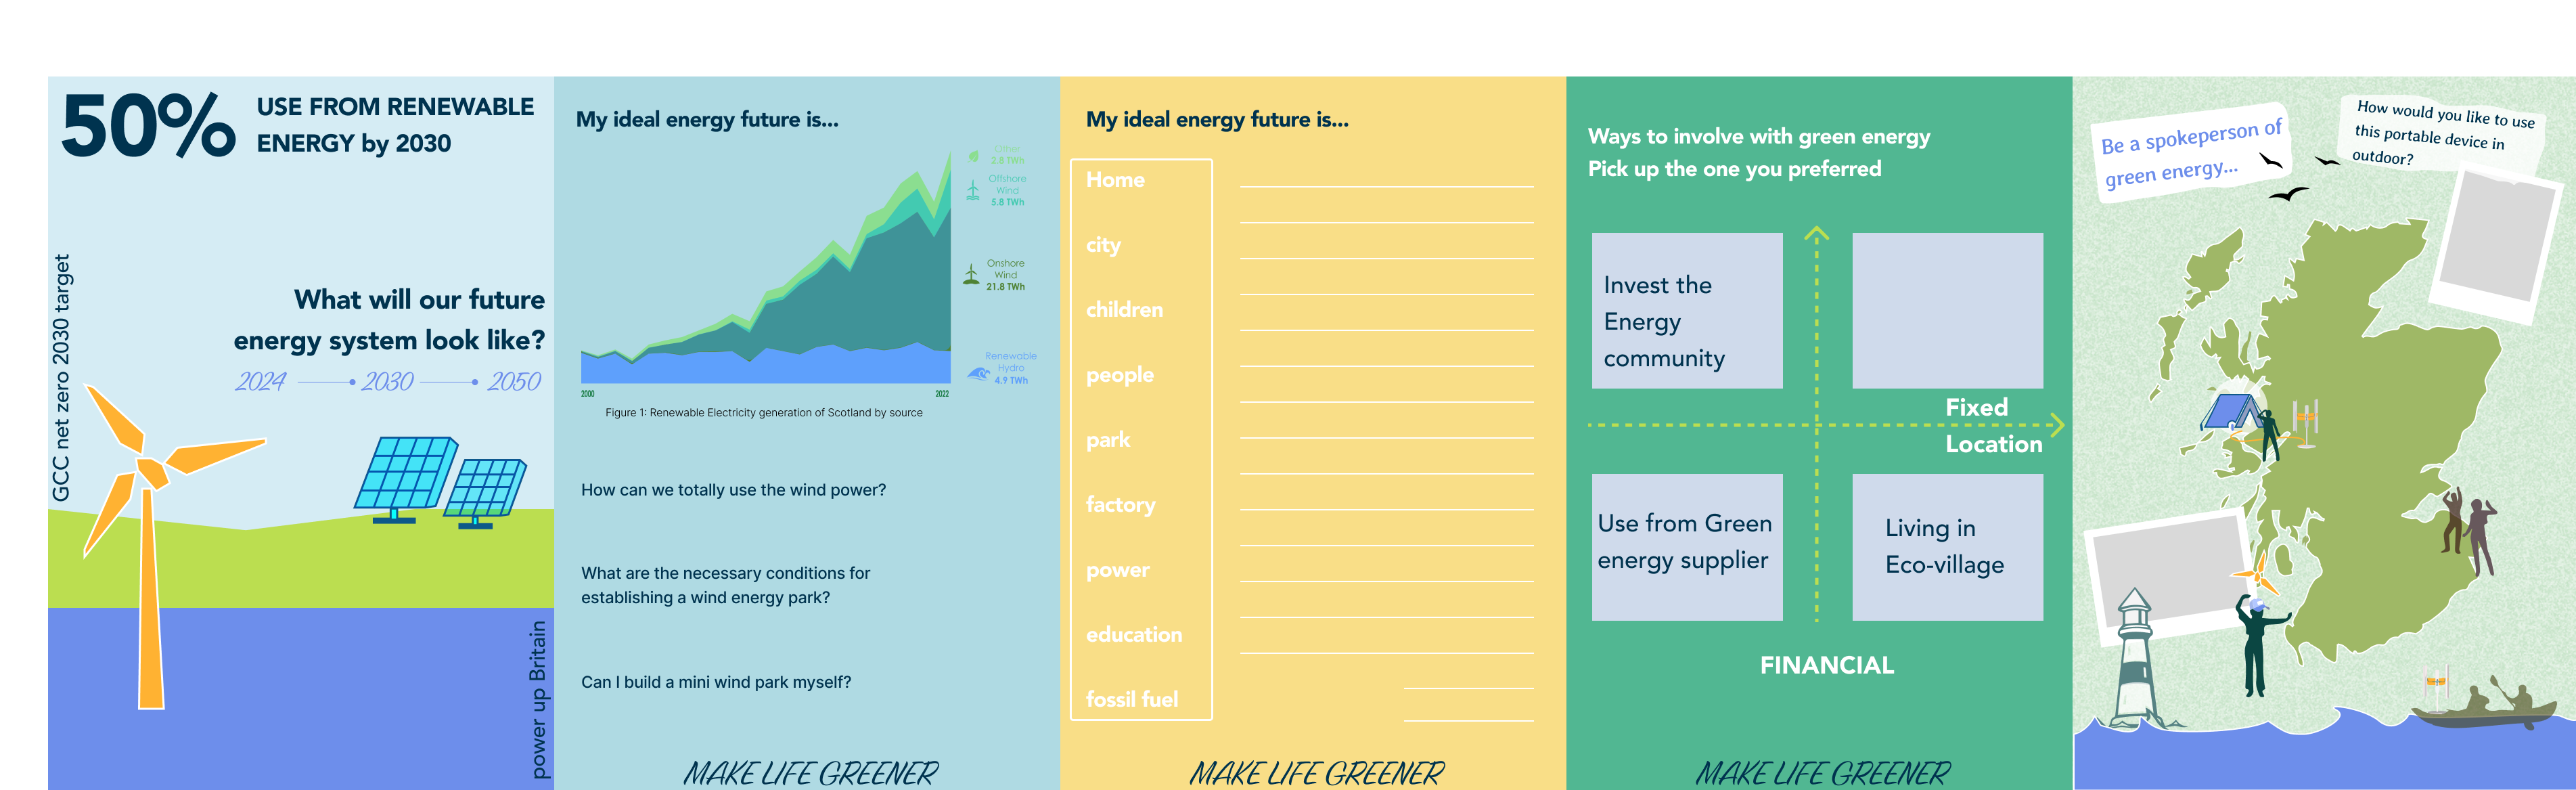
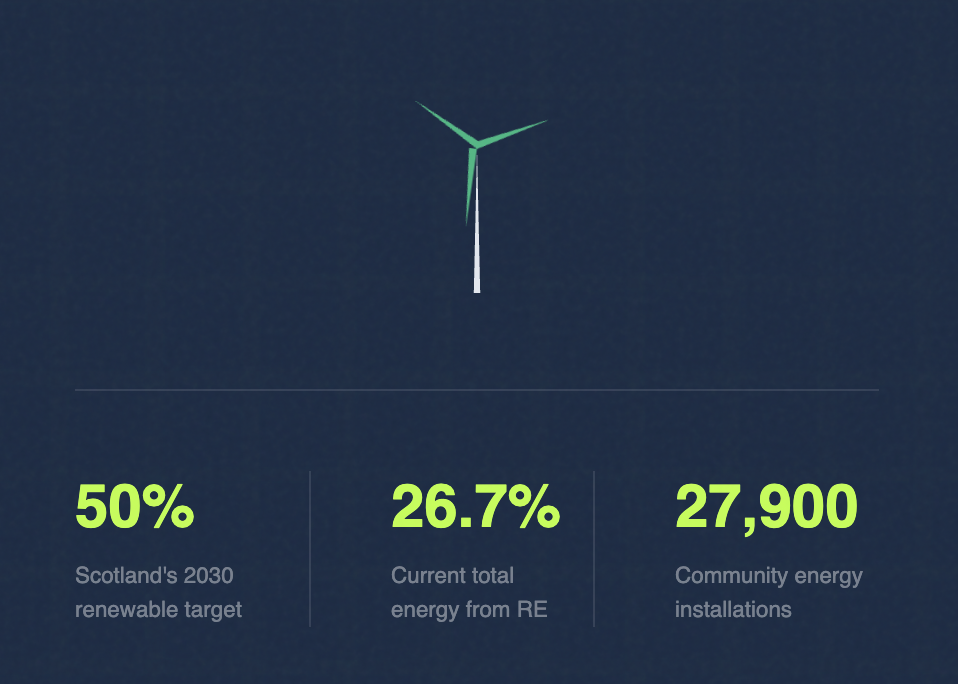
Scotland's 26.7% → 50% renewable target isn't a tech problem.
It's a translation problem.

I ran user research with 12 Glasgow residents. Three patterns emerged — and the same word kept coming back: invisible.

01 · Cognitive

"Solar panels don't work in Scotland — there's only a little sunshine."

People reject what they can't picture. "kWh" was a wall, not data.

02 · Financial

"I tried a renewable supplier. It was too expensive. I gave up."

No middle ground between £0 and £5,500/year community membership.

03 · Social

"This is the government's job, not mine."

Without visible peers acting, free-riding stays the rational default.
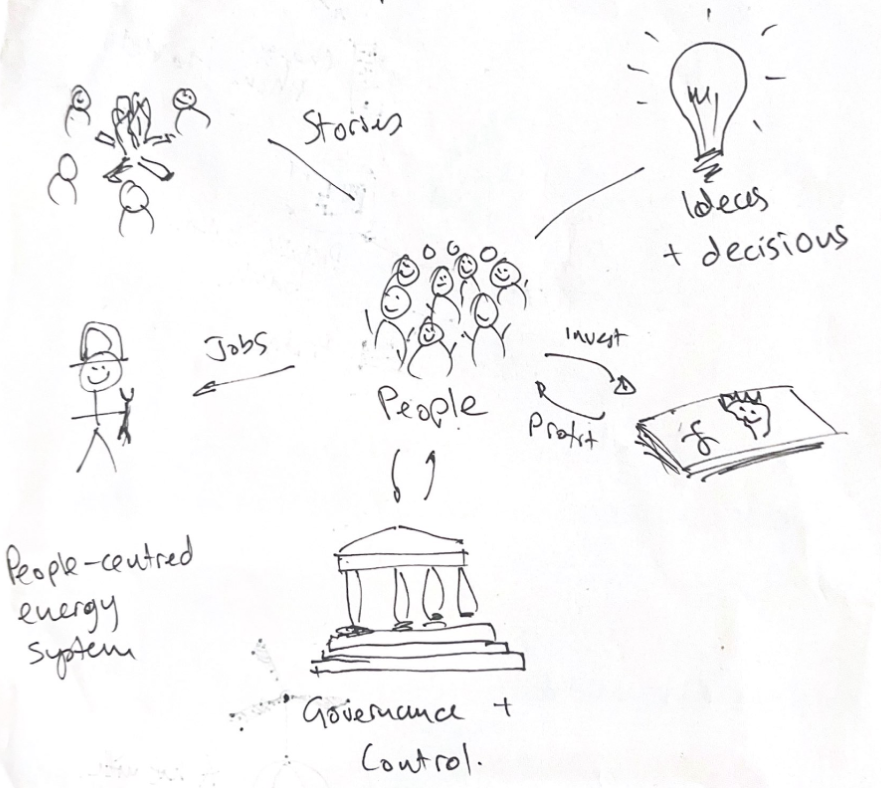
The reframe

Don't sell renewable energy. Sell verifiable outcomes — at a cost low enough to try without thinking.

03 · What Happened

The framing
was validated
by policy.

Workshop — barrier analysis
Workshop — scenario design
Workshop — people-centred energy system sketch

Workshop · Glasgow 2025 · 15 participants

The other outcome — awareness as infrastructure

Most people don't know that eco-villages, community energy co-ops, or shared neighbourhood grids even exist as options.

The tool doesn't just help people calculate energy — it surfaces participation pathways they've never heard of. Explorer, Contributor, Pioneer aren't just labels. They're the first time many users learn that you can lease a portable kit, join a solar co-op, or apply for a Warm Homes grant. The product works as a discovery layer: making the invisible landscape of renewable participation legible to ordinary residents.

Because it's a web tool — not a static PDF — it also functions as a live leaflet for outreach partners like Friends of the Earth and Community Energy Scotland. They can share a single URL at workshops, library events, or social media. The content updates once; every recipient sees the latest version. Distribution cost: zero.

Physical leaflet — 5-panel energy roadmap distributed at workshops and libraries

Physical counterpart — distributed at workshops & libraries alongside the web tool

What worked

Designing the unit translation (kWh → laptop hours) before the visual interface. The hardest design decision was conceptual, not UI. Once that was right, the calculator screen took two iterations.

What I'd change

I tested with 12 people but never measured the thing that matters: did anyone actually buy a portable kit after using the tool? Without that loop closed, the impact claim stays directional, not proven.